Projects / Dune Lakes revenue analytics
Dune Lakes revenue analytics
$122K of real booking revenue, analyzed down to a 12.6-point margin gap between booking channels
The problem
Dune Lakes runs on OwnerRez, whose raw booking export is messy: linked $0 “block” rows for multi-cottage bundles, mixed channels with very different fee structures, and cancellations that may or may not have touched real money. The business needed a clean answer to basic questions: how much revenue is actually on the books, which units and channels earn it, and what margin is left after variable costs.
What I did
I built a one-command Python pipeline (pandas) that ingests the OwnerRez Booking Detail export and produces a formatted Excel workbook and charts:
- Data cleaning: filtered out the $0 linked block rows so only
revenue-carrying bookings count, and validated fees against the actual
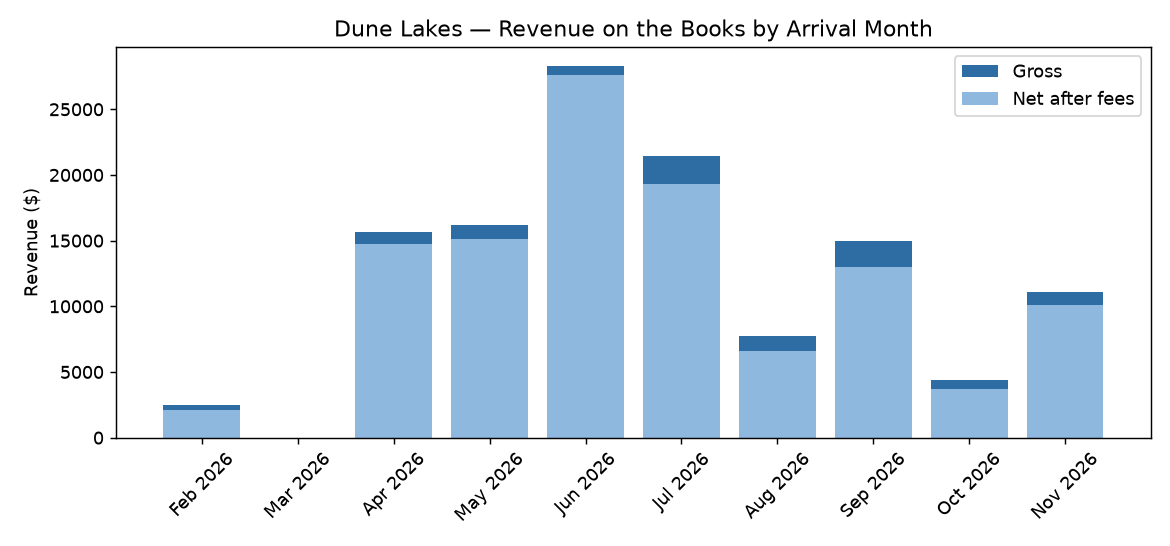
Host Feescolumn instead of assuming rates. - Revenue on the books: confirmed gross and net revenue, nights, and ADR by arrival month, split into realized and upcoming.
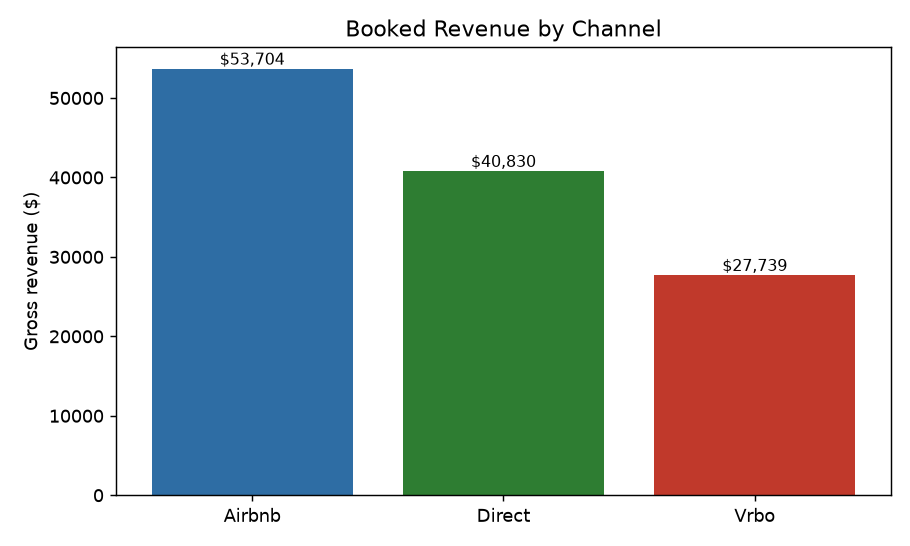
- Channel economics: fee load by channel, derived as gross total minus net total. Airbnb carries a 15.5% host fee, flat on every single booking, versus 2.9% on direct. So every booking shifted from Airbnb to the direct site is worth roughly 12.6 points of margin. That is the strongest single finding in the analysis and it is measured, not assumed.
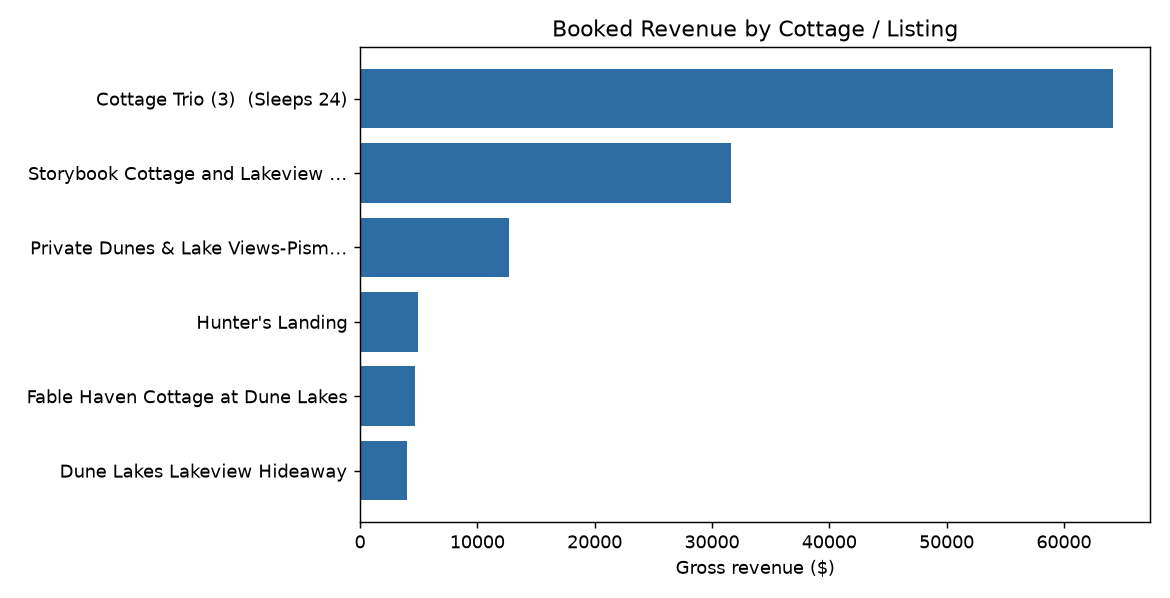
- Unit performance: the whole-compound “Cottage Trio” listing alone is 52% of revenue at a $2,790 ADR. The large-group listings carry the business.
- Cancellations and margin: separated real refunds ($7.5K across 2 paid cancellations) from pre-payment noise, and built a contribution margin and sensitivity view (roughly 86% before fixed costs).
What I got wrong, and fixed
The first version of this analysis compared all three channels as though the same thing were being measured. It wasn’t.
Airbnb’s 15.5% is a genuine channel commission: it appears on every booking at exactly the same rate, which is the signature of a flat fee. The direct-site figure of 2.9% is credit card processing, since no channel takes a cut on a direct booking. But the Vrbo figure of 2.2% has the same processing signature, ranges from 0% to 2.9% across bookings, and is zero on one of them. Vrbo’s commission is deducted upstream and never reaches this export, so the analysis was not measuring Vrbo’s channel cost at all. Presenting it next to Airbnb’s implied Vrbo was nearly as cheap as booking direct, which is false.
Vrbo’s published pay-per-booking rate is about 8%. Applying it as a stated assumption rather than a measurement, blended fee load across the business rises from 8.3% to 9.6%, and contribution margin falls by roughly a point and a half. The workbook now carries both figures: what the data shows, and what it shows once the missing commission is modeled.
Honest caveats, on purpose
The analysis only claims what the data supports. True occupancy is deliberately not reported because the export lacks availability calendars, and I’d rather omit a metric than fake it. Operating cost estimates are clearly labeled as estimates, as is the Vrbo commission rate above.
Skills demonstrated
Financial analysis, revenue analytics, unit economics, channel and margin analysis, scenario and sensitivity analysis, data cleaning, KPI reporting, Python (pandas), Excel model build.