Projects / Data centers and the grid, in SQL
Data centers and the grid, in SQL
US electricity demand is 127 TWh above trend, and five states hold 60% of the overshoot
The question
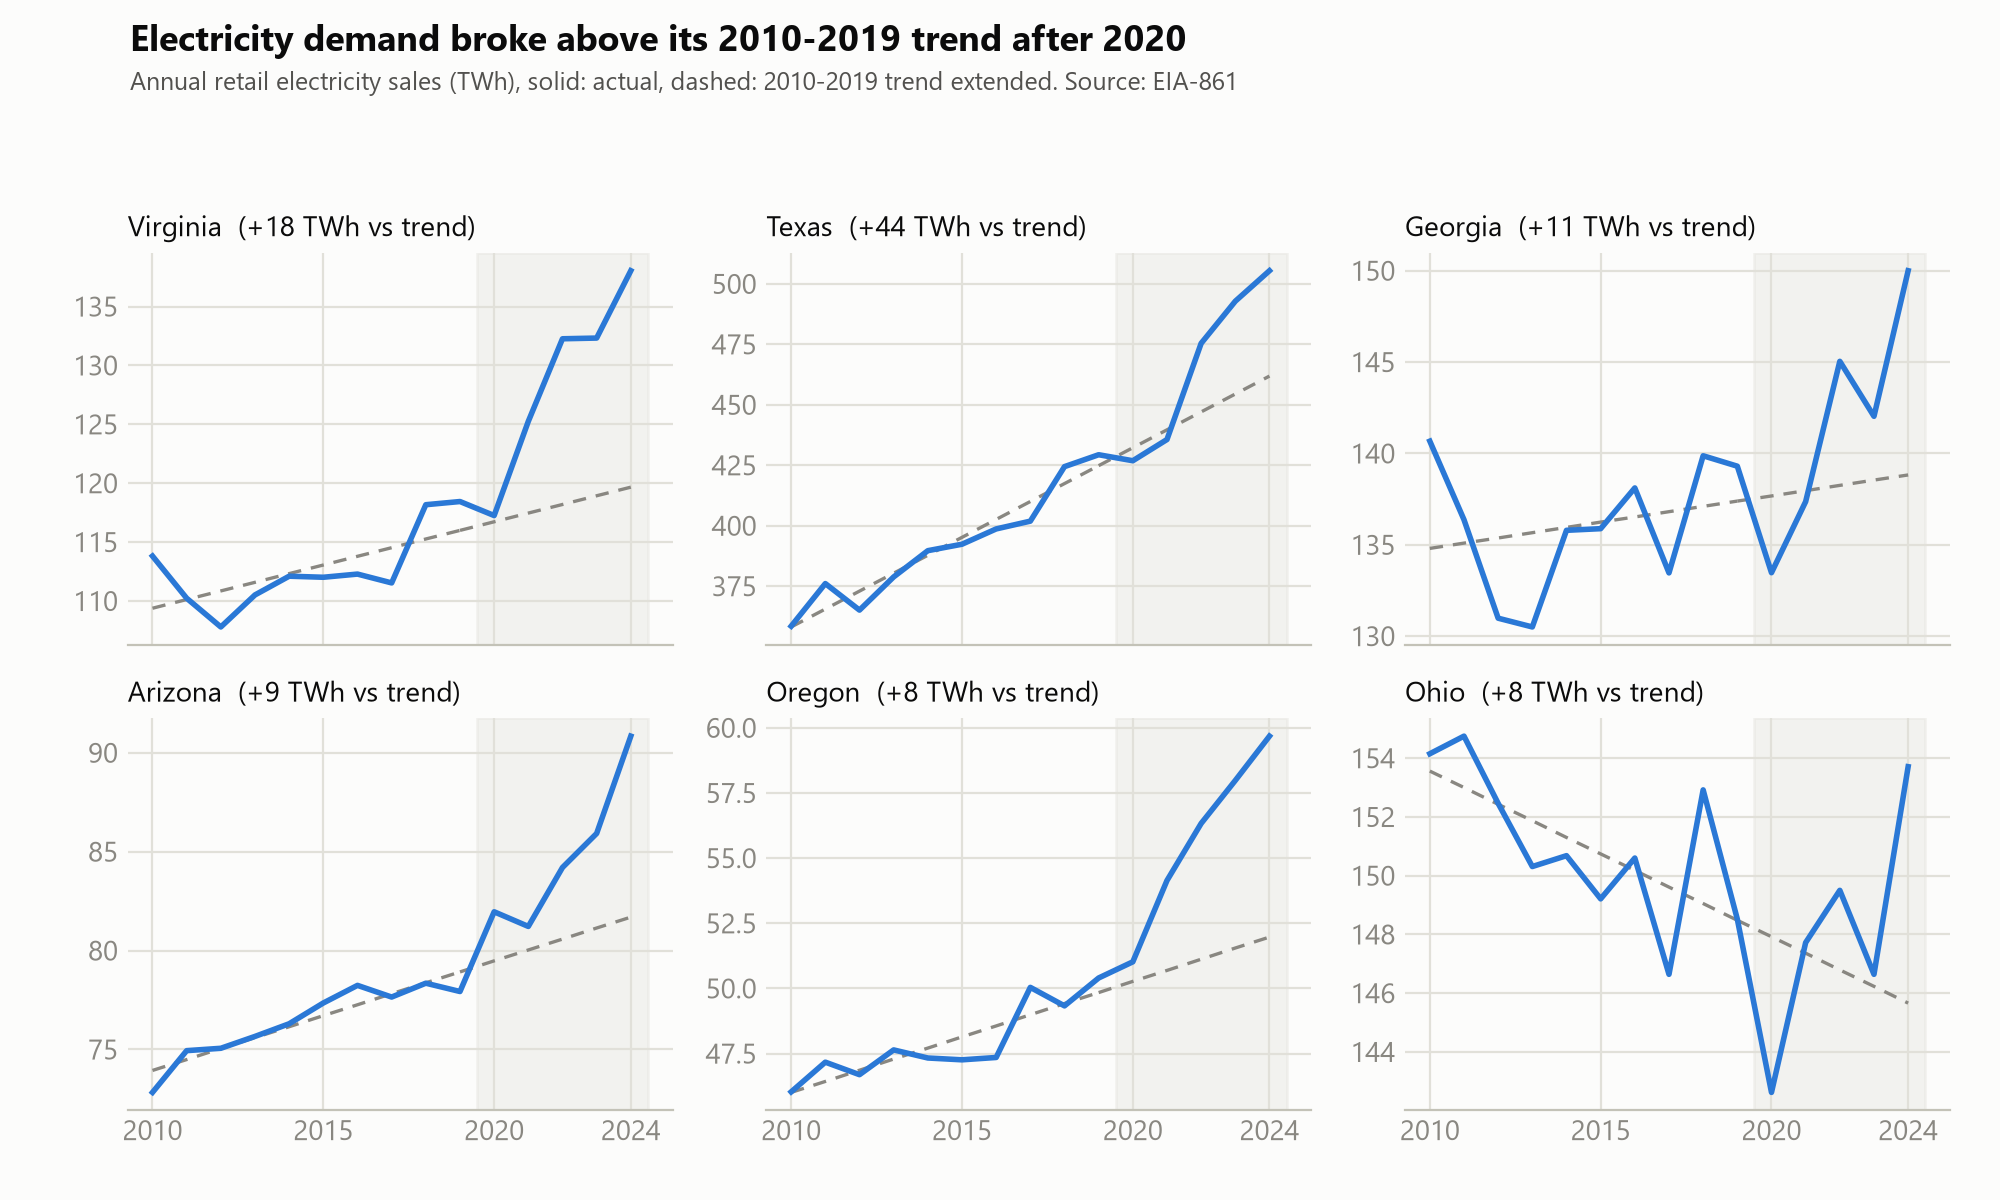
US electricity demand was basically flat for 15 years. Around 2022 it bent upward, and everyone blames or credits data centers. I wanted to answer three things with public data: which states actually broke above their long-run demand trend, does the excess really look like data centers, and is supply showing up where the demand is?
How it works
Everything runs in SQLite. Python only downloads the EIA files, loads a normalized five-table schema, and draws the charts; the analysis itself is six readable SQL files. The core is an ordinary least squares trend fit written directly in SQL: each state’s demand is fit on 2010-2019, extended through 2024, and compared with what actually happened. Window functions handle the rankings and growth rates, and a seeded assumptions table converts proposed generator capacity into estimated annual energy.
What the data says
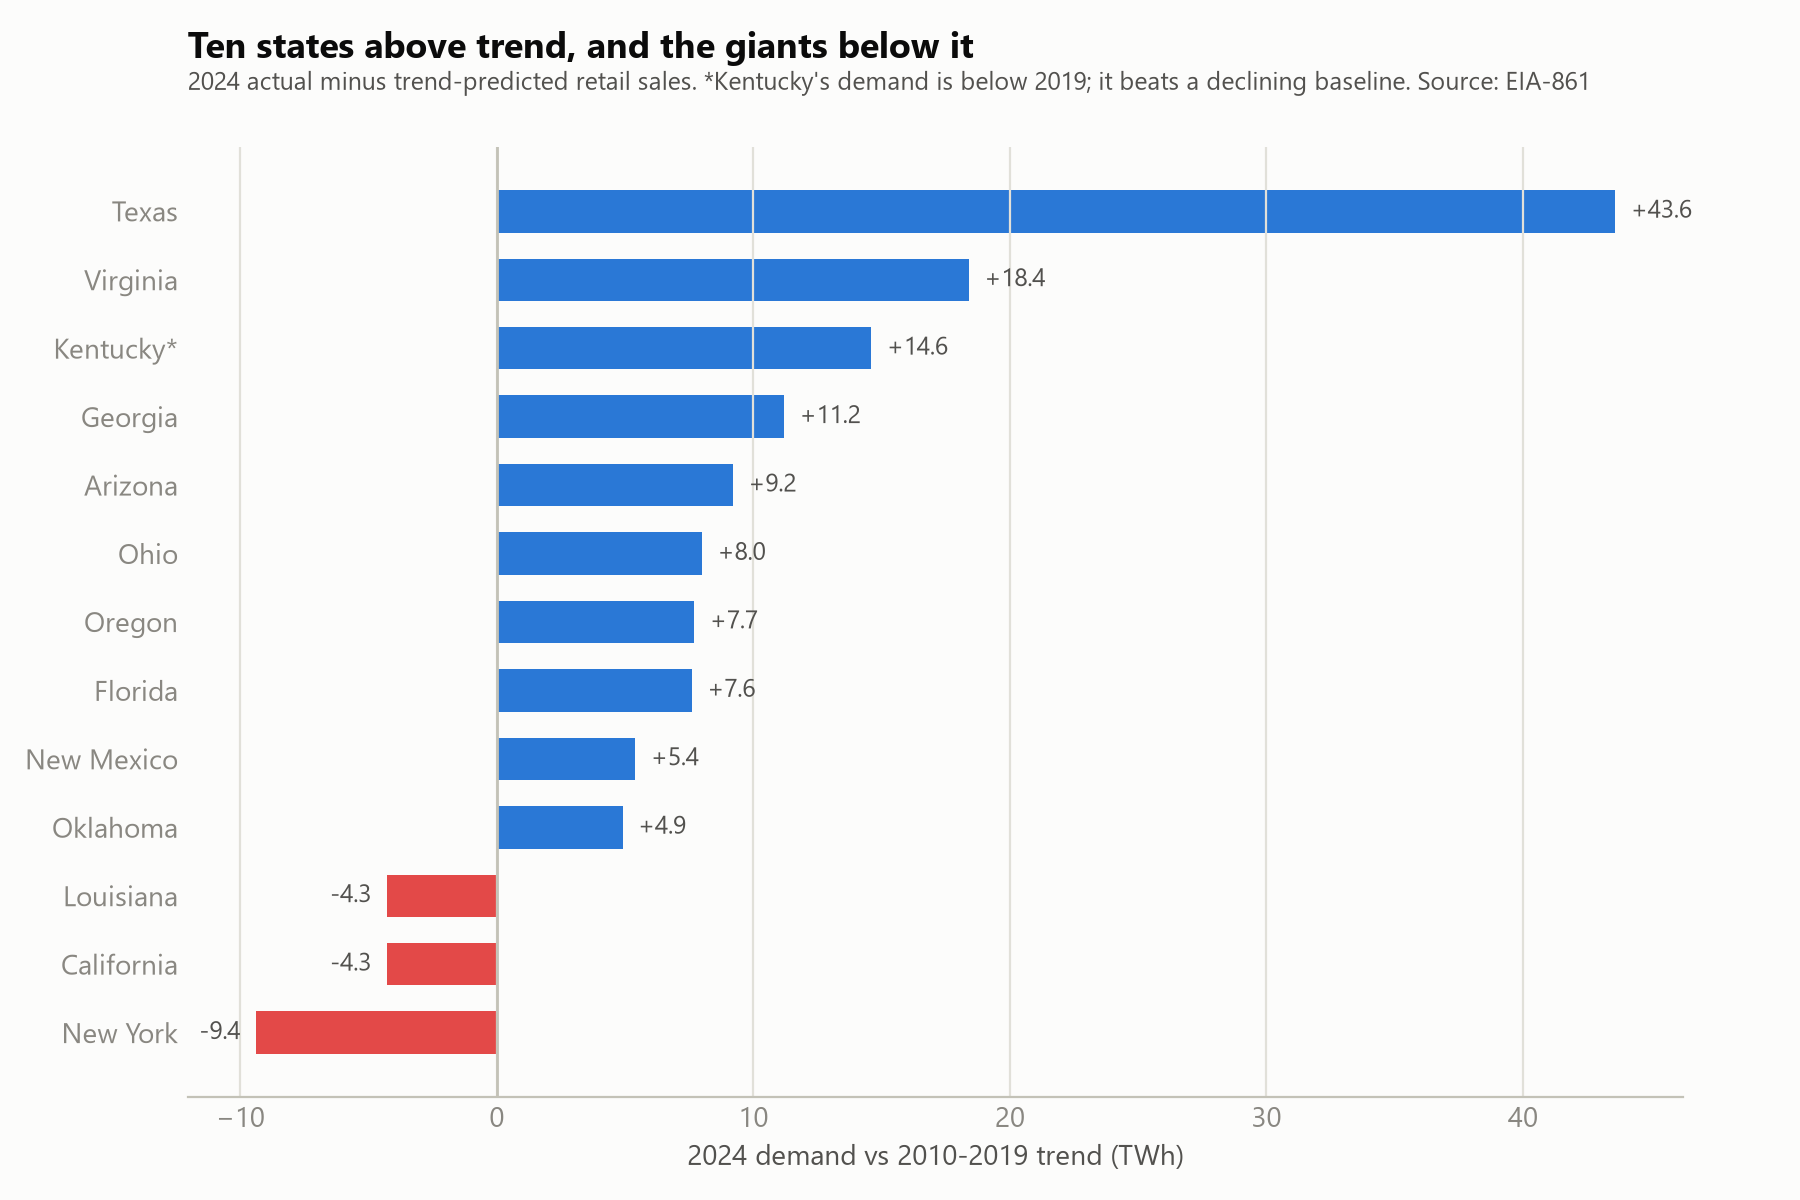
- The break is real and concentrated. 2024 US retail electricity sales ran 127 TWh (3.3%) above the 2010-2019 trend. Texas (+43.6 TWh), Virginia (+18.4), Kentucky (+14.6), Georgia (+11.2), and Arizona (+9.2) hold 59.7% of the positive excess. New York and California sit below trend.
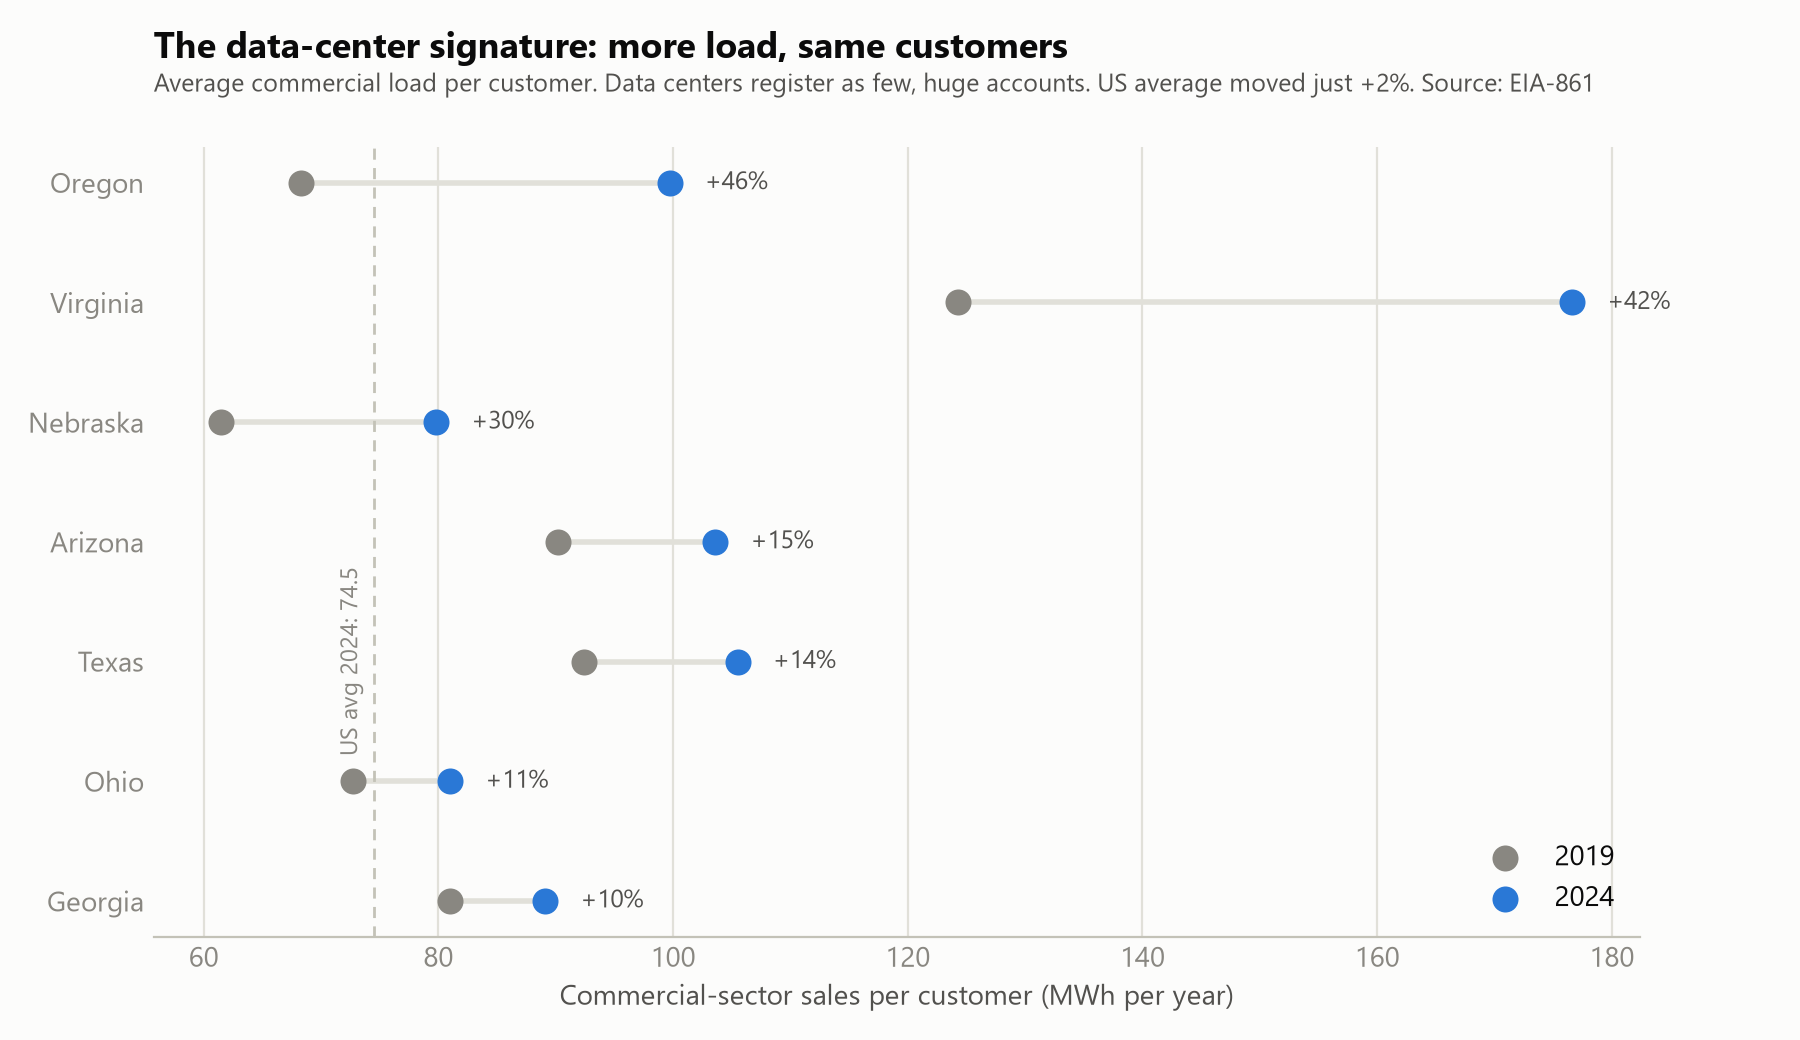
- The data-center signature is commercial load per customer. Data centers show up as a few huge commercial accounts. Virginia’s commercial sales per customer rose 42% in five years while its customer count grew 2.7%. The US average moved 2.3%.
- Not every hot state is a data-center story. Texas’ surge is roughly half industrial (LNG, chips, crypto). Kentucky’s demand is still below 2019; it only ranks high because its old baseline was declining. I kept that in the write-up on purpose, because the trend metric alone would mislead.
- Virginia is the outlier on supply. It met 19.6 TWh of new demand with 5.9 TWh of new in-state generation, and its import gap widened more than any other state. Its proposed pipeline covers about 1.0x its excess demand, versus 3.0x for Texas.
Honest caveats, on purpose
EIA does not tag “data center” as a customer class, so the per-customer signature is strong circumstantial evidence, not direct attribution. The pipeline energy figures are labeled estimates built on assumed capacity factors. And the trend method itself gets a warning label in the repo, because it flags declining states that merely stopped declining.
Skills demonstrated
SQL (schema design, joins, CTEs, window functions, regression in SQL), data analytics, data visualization, reproducible pipelines, Python, energy economics, honest reporting of estimates and limitations.