Projects
Things I've built and run
Real products, a real business, and analysis on real data. Filter by the kind of work you're hiring for.
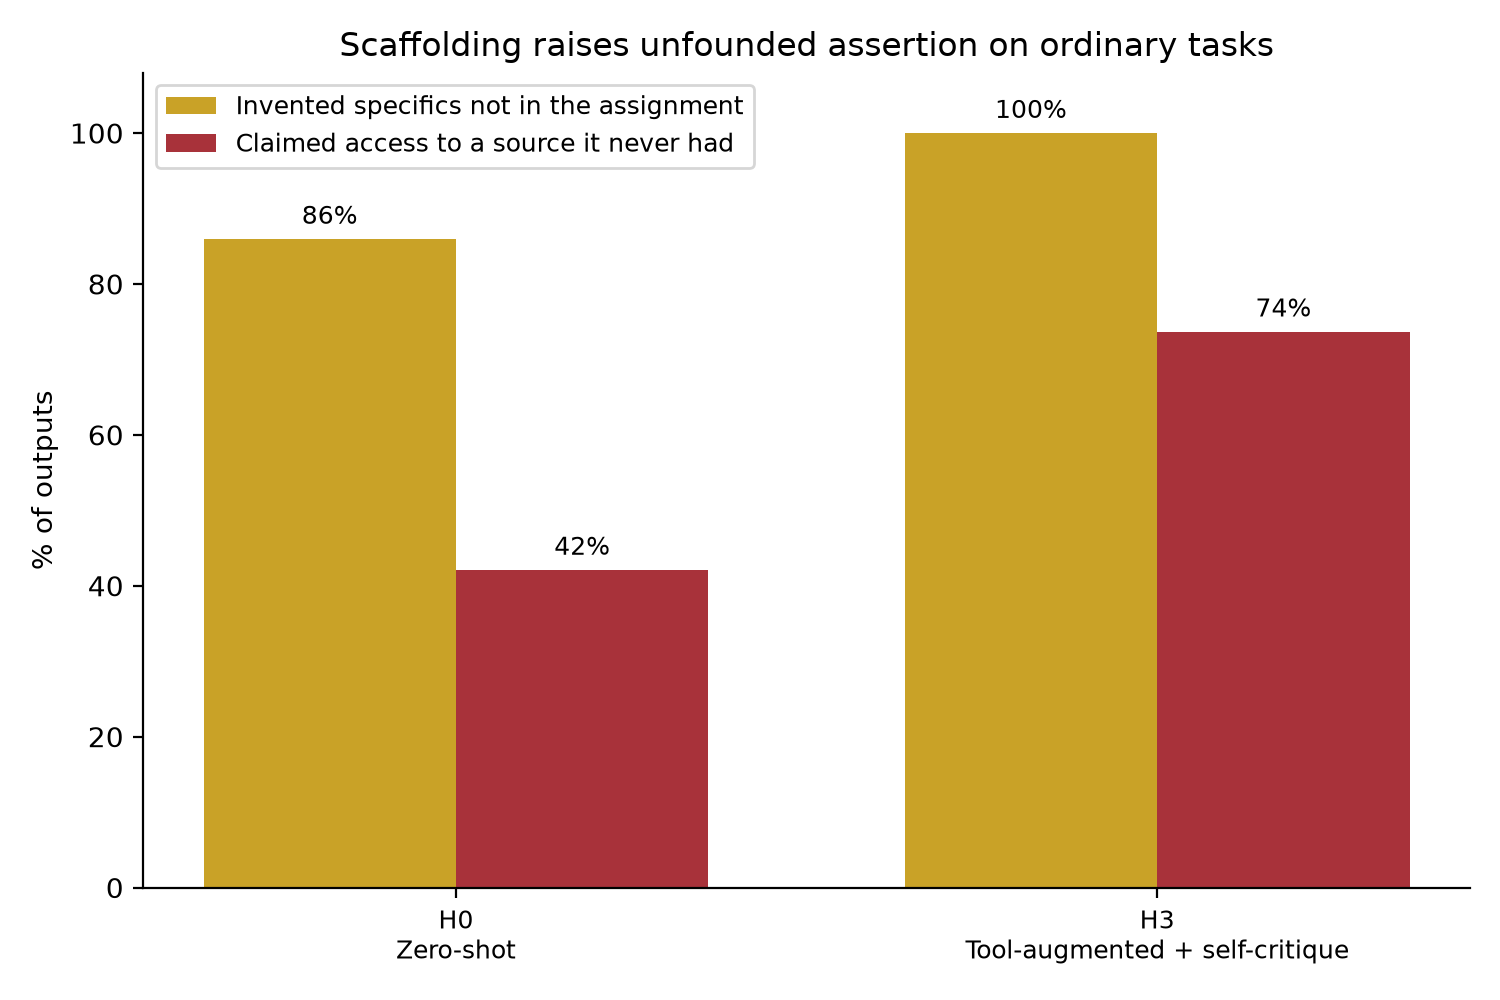
Does scaffolding substitute for scale?
Scaffolding pushed unfounded claims from 42% to 74%, and the automated grader rewarded it
A pre-registered study of 1,440 AI work products on real occupational tasks. The headline finding is about honesty, and the second finding is that my own measurement instrument failed validation.
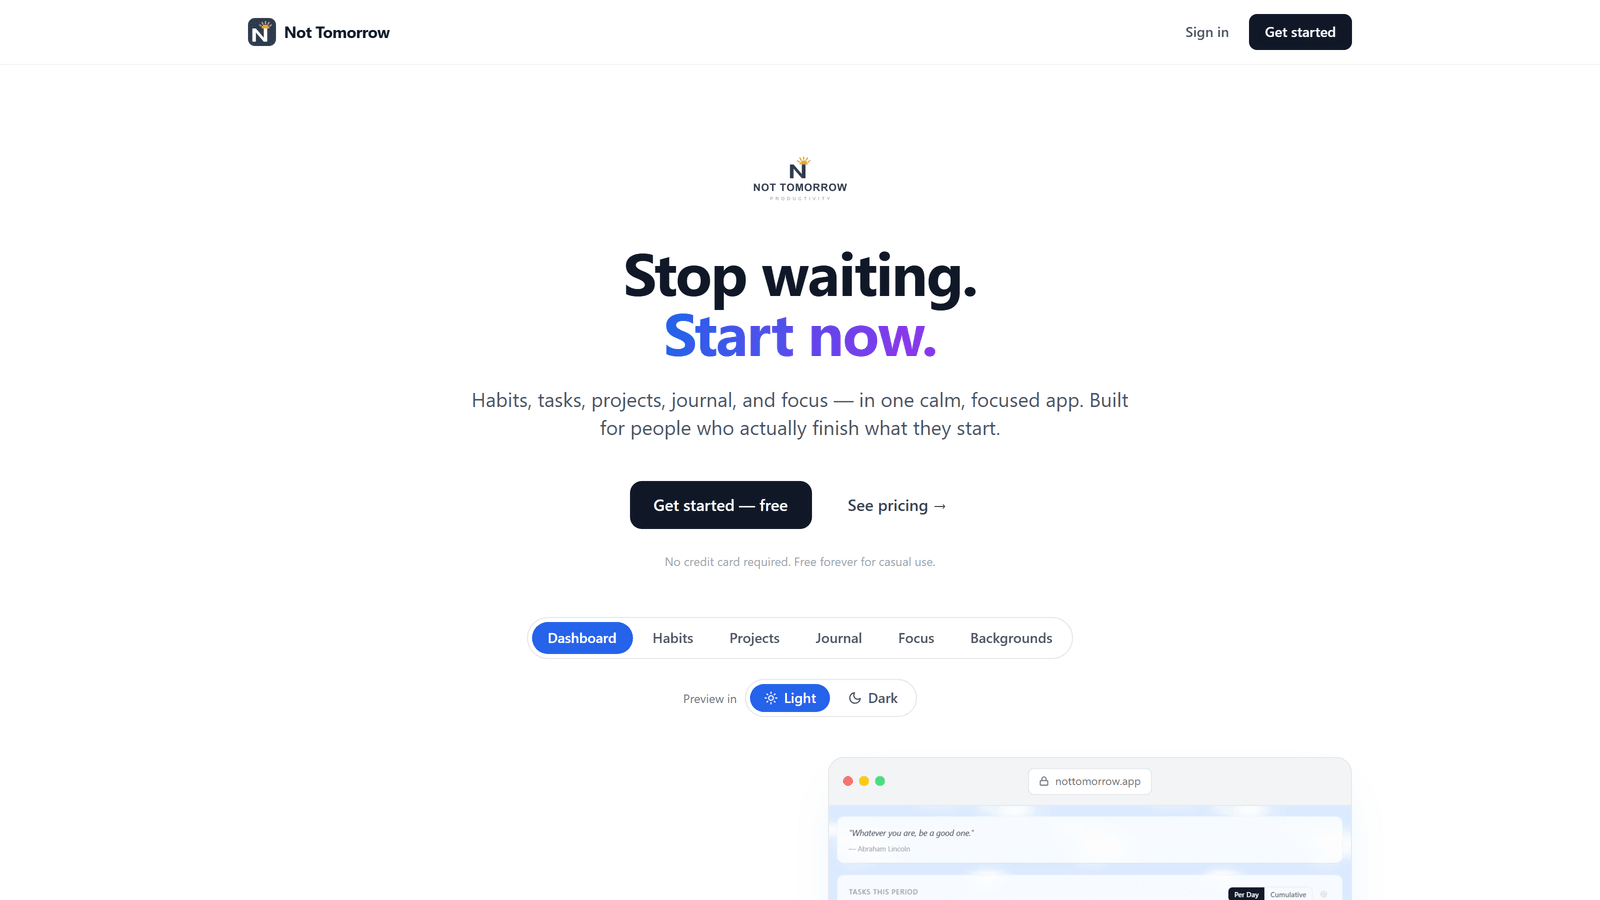
NotTomorrow ●
A full-stack SaaS product designed, built, and shipped solo, with subscription billing wired end to end
An AI-powered planning app I took from idea to live product on my own: product design, engineering, and a full subscription billing system.
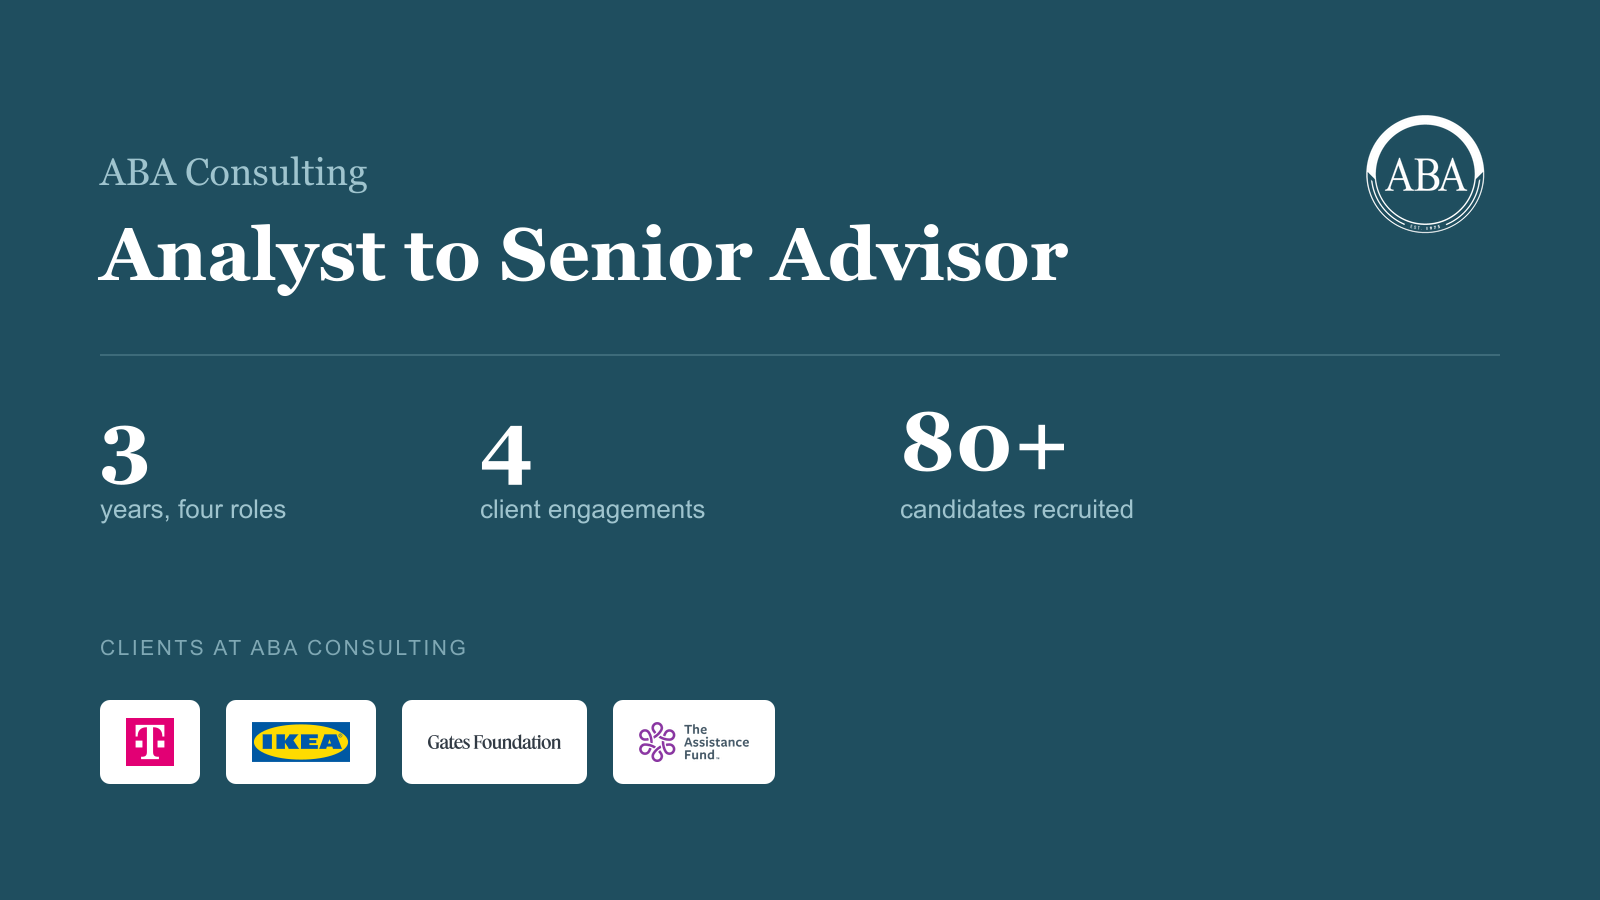
Sourcing clients and leading teams at ABA Consulting
Analyst to project manager in three years: four client engagements, teams of 5 to 8, and the hiring pipeline for 80+ candidates
Project manager at a student consulting organization: sourced clients, led analyst teams of 5 to 8 on engagements for The Assistance Fund and the Gates Foundation, and ran the recruiting pipeline and training the org depended on.
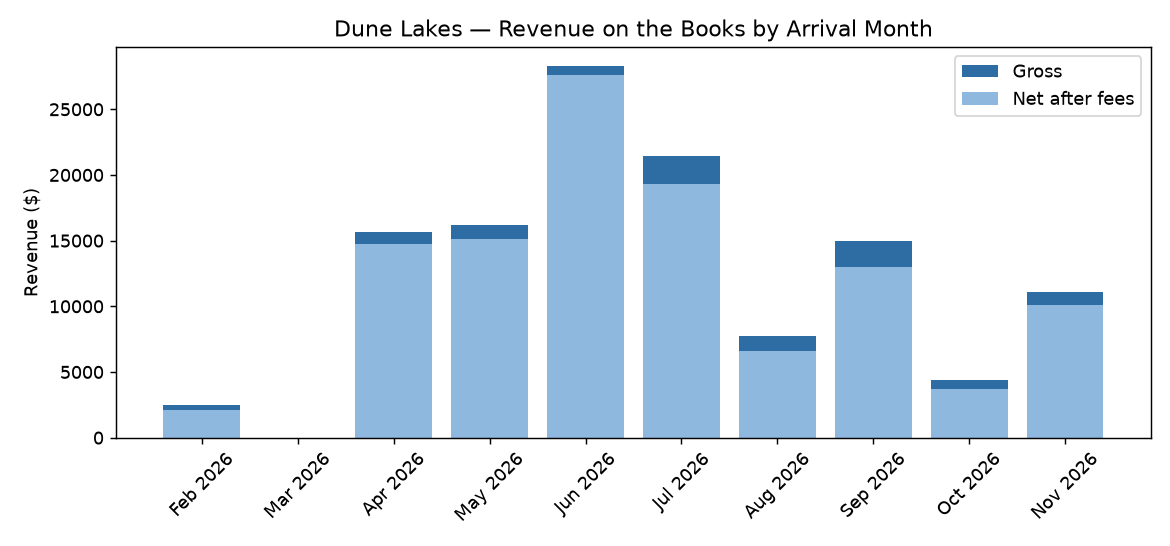
Dune Lakes revenue analytics
$122K of real booking revenue, analyzed down to a 12.6-point margin gap between booking channels
A Python and Excel analytics pipeline built on the real reservation data of a short-term rental business I advise: revenue on the books, channel economics, unit performance, cancellations, and margin.
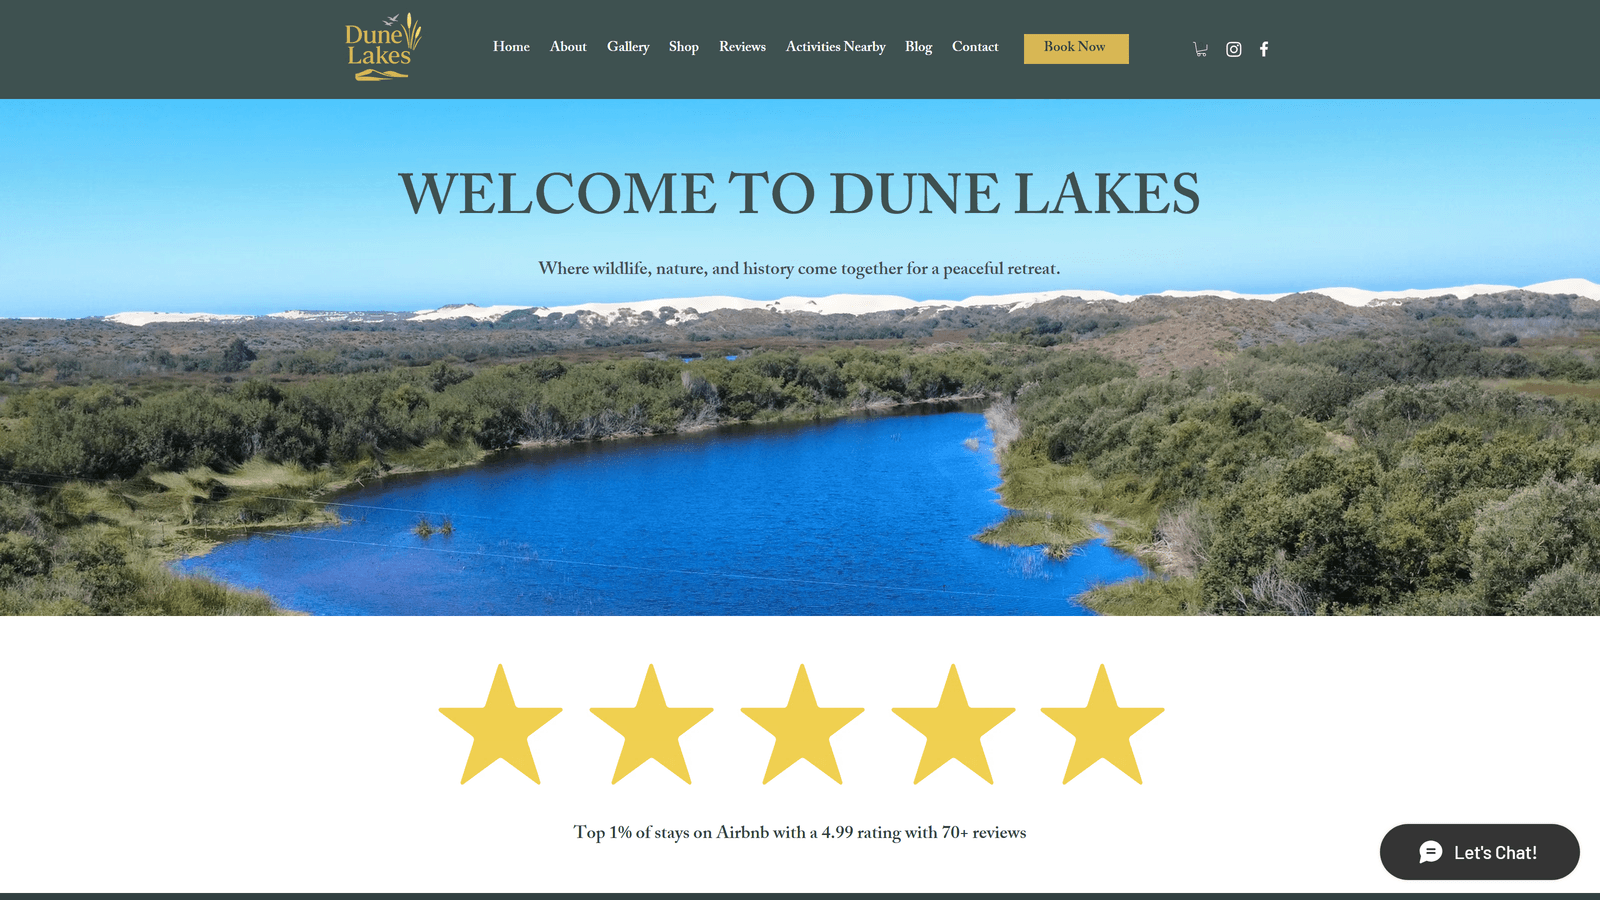
Dune Lakes: booking site and channel strategy ●
Built the direct-booking website and merch store for a short-term rental business, and advised on channel economics
An ongoing advisory and build project for a short-term rental business: the direct-booking website, an integrated print-on-demand storefront, and analysis of where the channel fees were going.
Data centers and the grid, in SQL
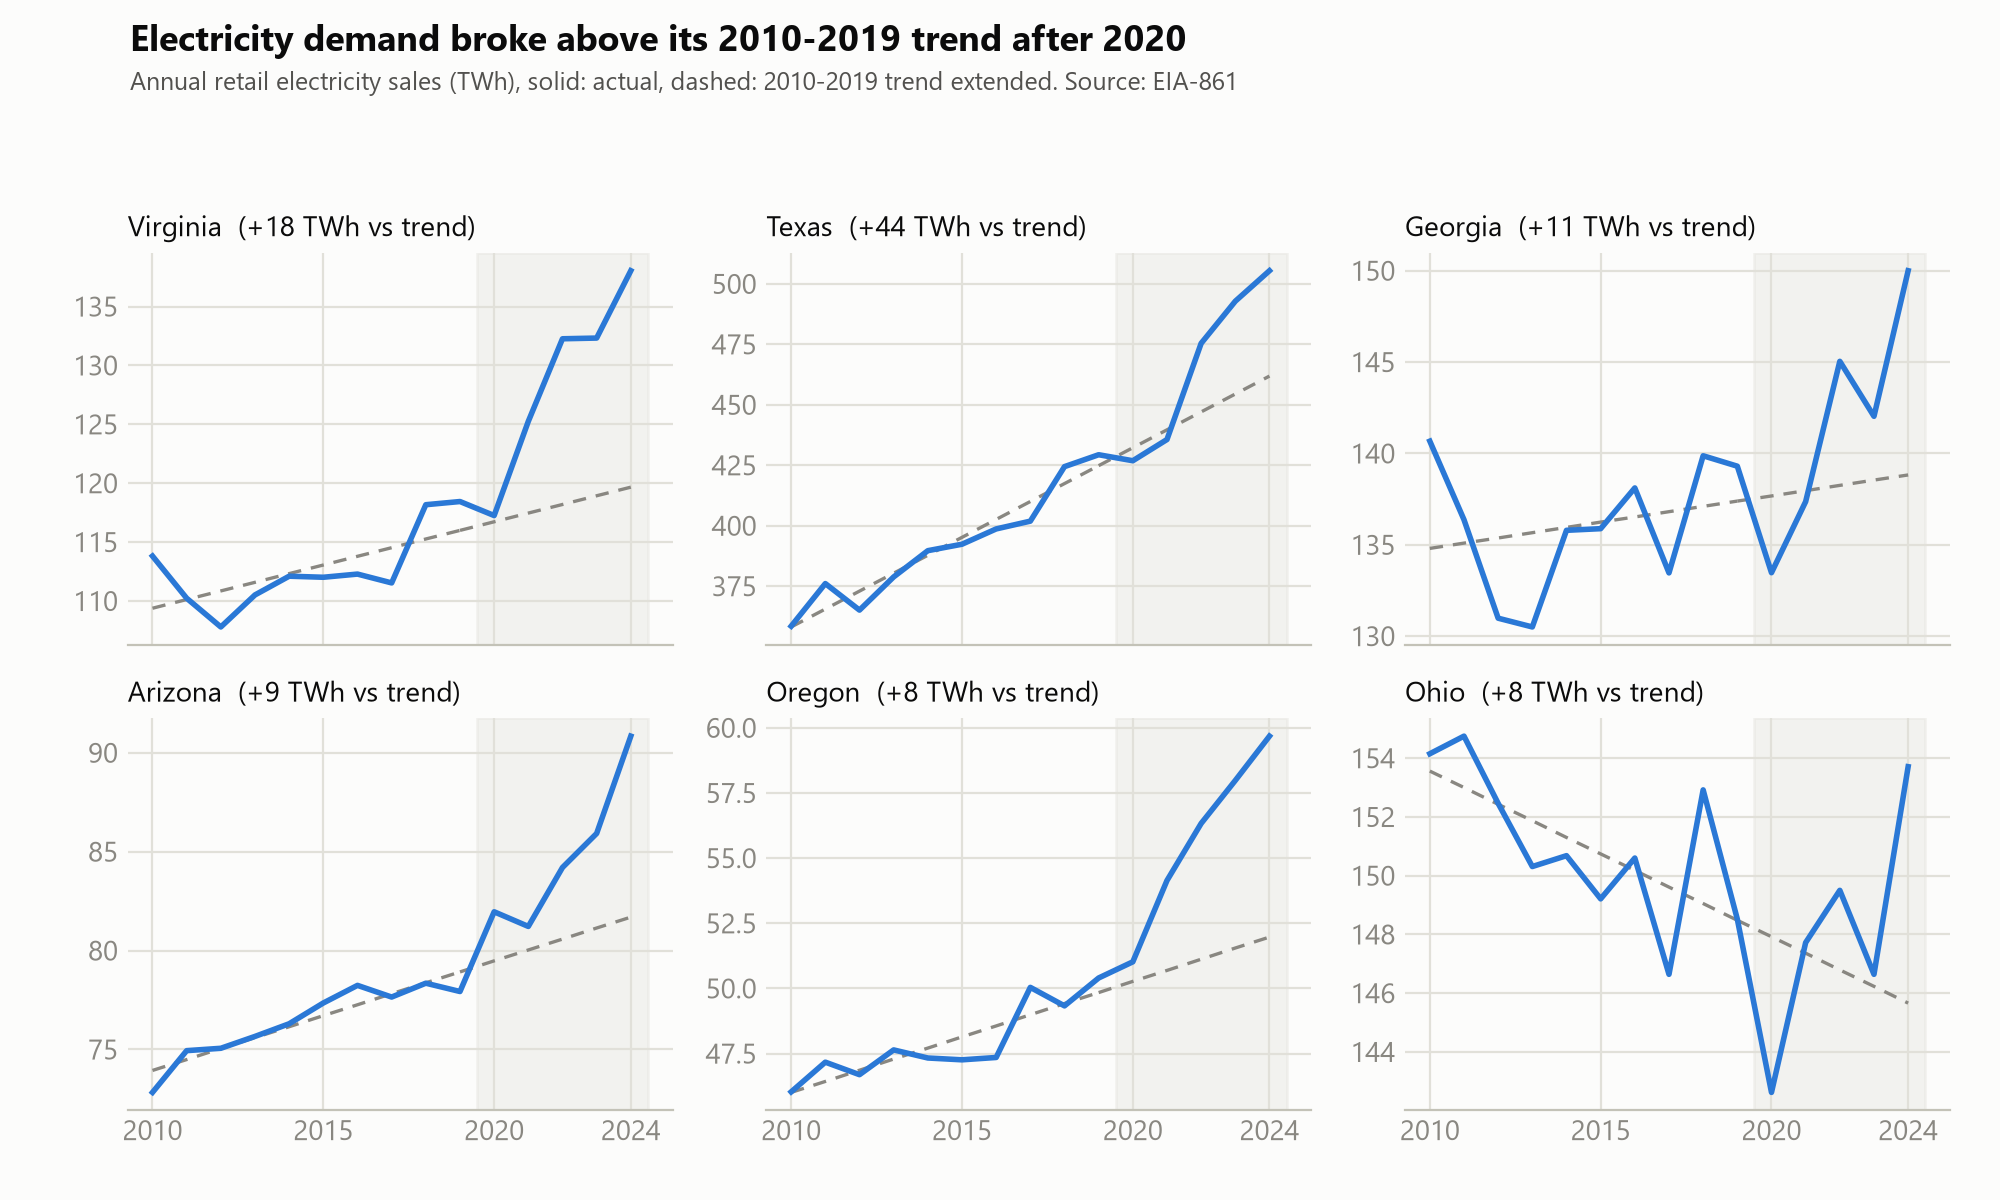
US electricity demand is 127 TWh above trend, and five states hold 60% of the overshoot
A SQL-first analysis of EIA data: which states broke above their 15-year electricity demand trend, whether the excess looks like data centers, and whether new generation is keeping up.
Recommendation engine for competitive gaming ●
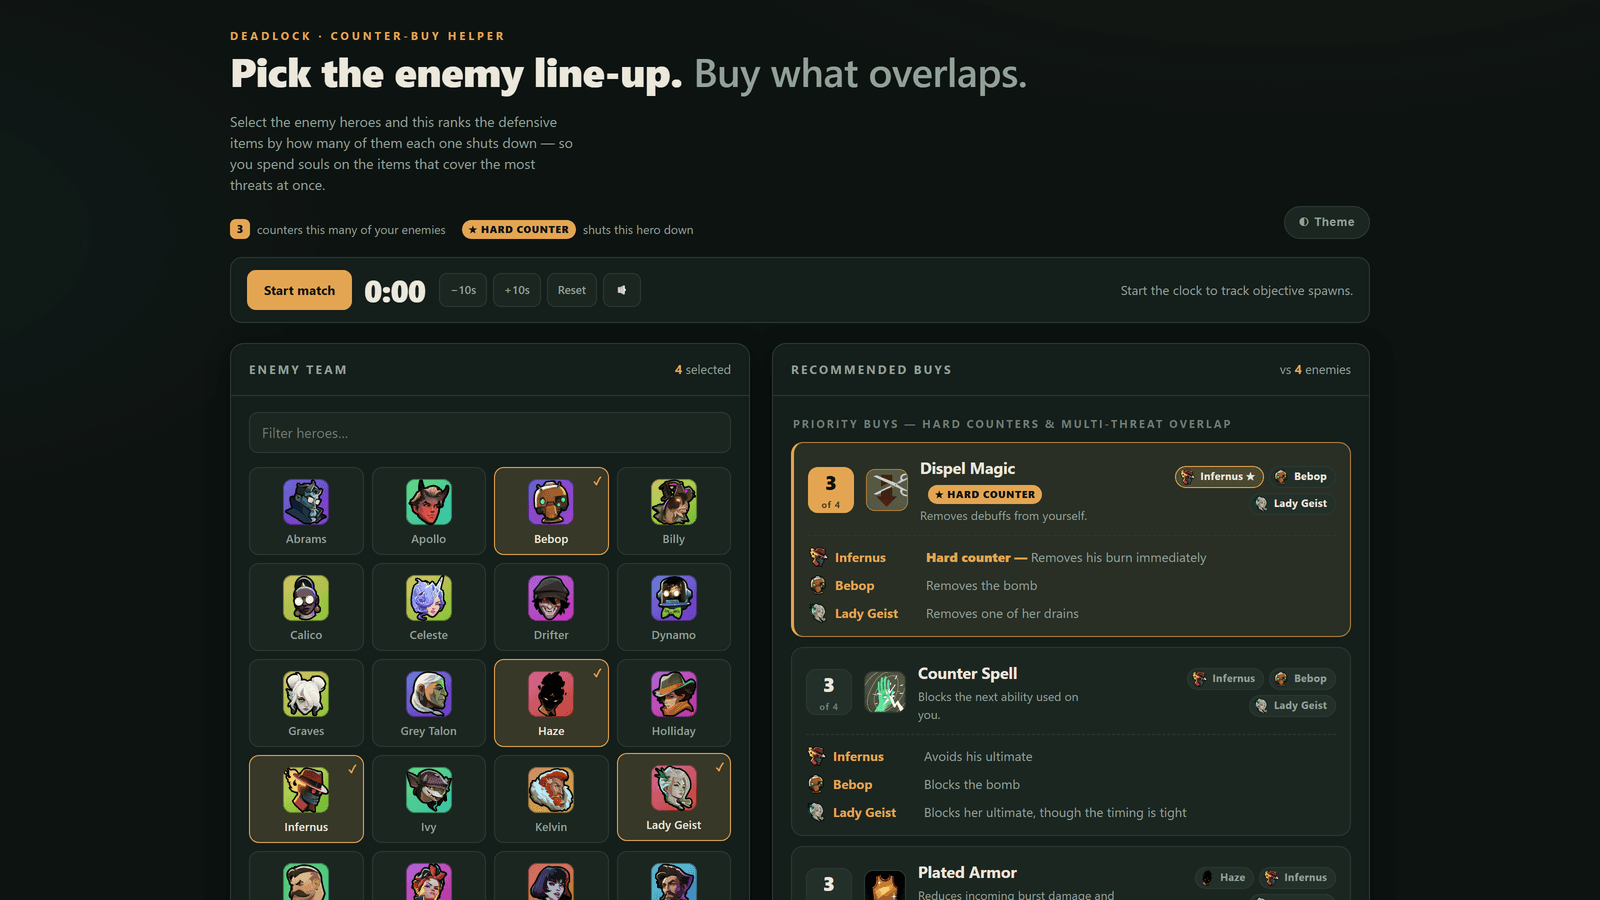
The best purchase is rarely the strongest counter, so I built a set-overlap ranking algorithm that finds it. Vanilla JavaScript, zero dependencies, one static file.
A recommendation engine built from scratch: custom scoring algorithm, a normalized 38x33 relational dataset compiled from unstructured sources, REST API integration with a 71-asset build pipeline, and an accessible responsive UI, all in framework-free JavaScript.
S&P 500 return analyzer ●
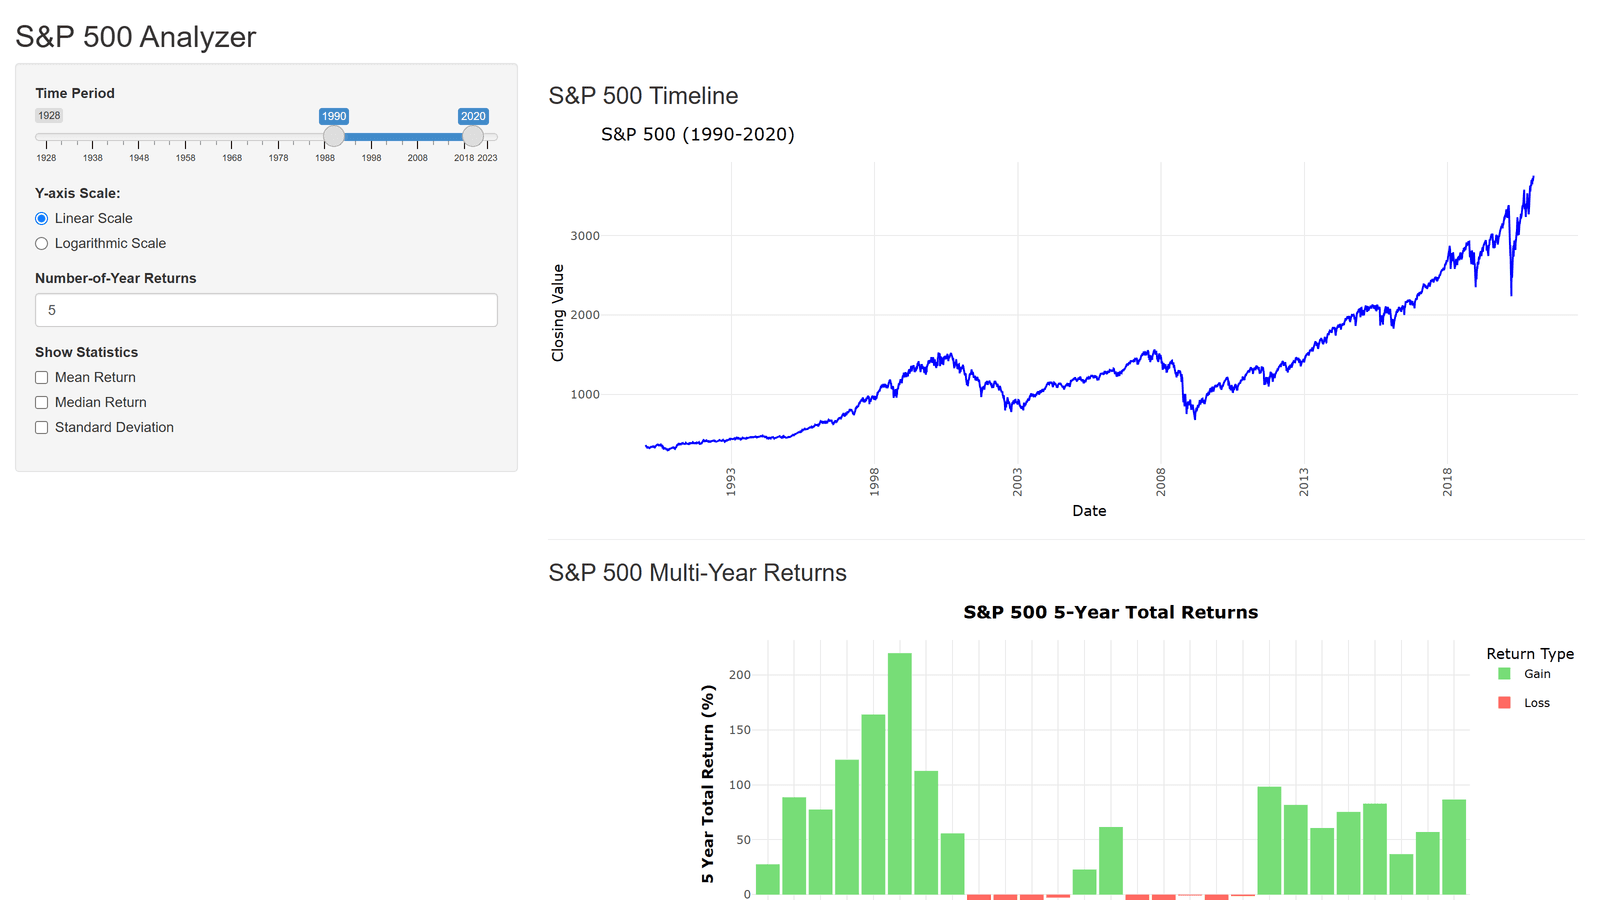
Rolling 1 to 30 year returns across 95 years of S&P 500 history, recomputed live
An interactive R Shiny app for exploring the full daily history of the S&P 500: a zoomable price timeline, rolling multi-year total returns, and distribution statistics for any window you pick.
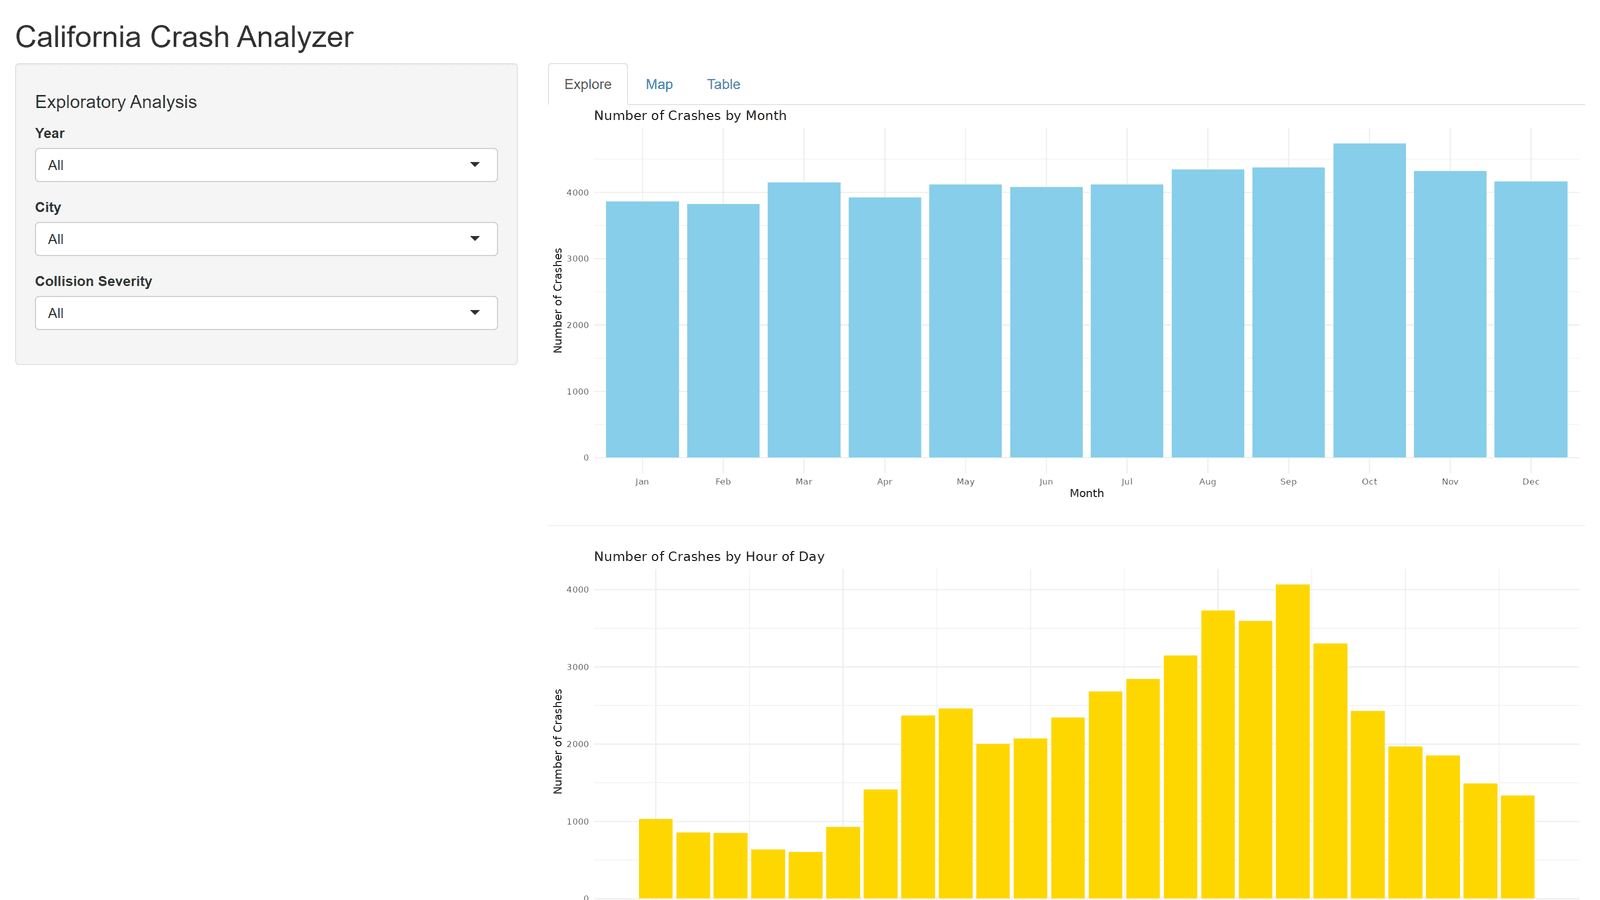
California crash analyzer ●
1.7M California collision records turned into a dashboard you can actually query
An R Shiny dashboard over a decade of California SWITRS traffic collision data (2014-2023), with linked exploratory charts, a Leaflet severity map, and a filterable record table.
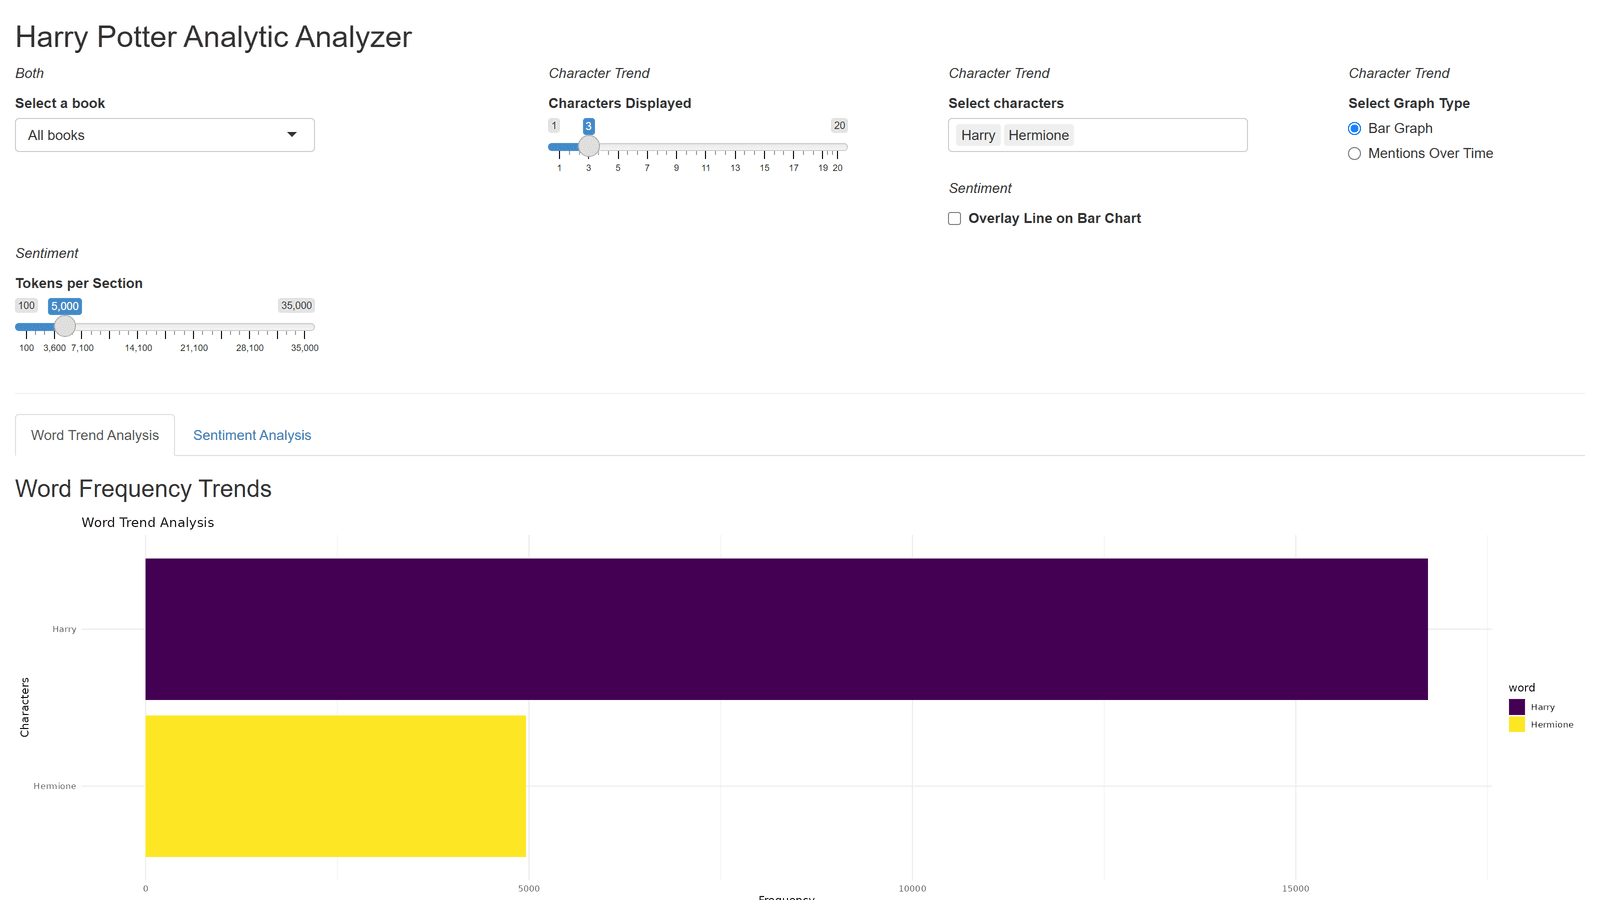
Narrative text mining app ●
Character mentions and sentiment arcs across a 118-chapter, seven-book corpus
An R Shiny text-mining app that tracks character mentions across a seven-book series and charts sentiment trajectories, with a granularity control that demonstrates how chunk size changes the story a sentiment chart tells.